
NATIVE WARM SEASON GRASSES – YEAR 2
The first year of our research collaboration with University of Tennessee (UT) brought about a series of learning opportunities in regards to large scale field-research (as mentioned here). Those lessons learned will be carried over to year two (2020) as we repeat the study, hopefully providing better outcomes than we had in 2019.
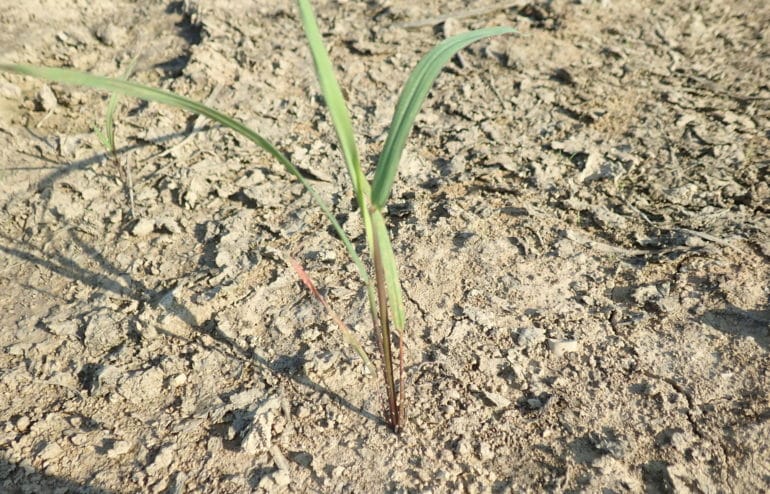
In 2020 one of the primary objectives based on our 2019 results is to get an earlier start. In 2019, planting was delayed 2 months (July 2nd vs May 2nd) due to the wetter than “normal” spring. This meant that the native grass seedlings had to compete with not only the nurse crop treatments but also the vigorous summer annuals that were present in the seedbank (e.g. Panic grass, Ragweed and Marestail). Getting the grasses planted earlier means getting the nurse crop treatments planted earlier – giving them both a slight jumpstart, and thus a competitive advantage, on the inevitable weed pressure that warmer weather brings with it.
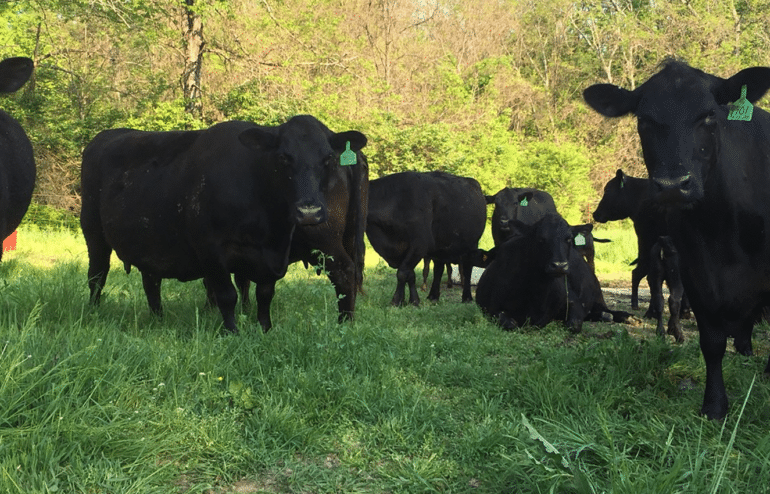
The second objective – which we learned the hard way in 2019 – is to increase the amount of cattle impact necessary to manage the nurse crop canopy. We learned once the canopy gets ahead of us we can forget about any attempt at a successful native warm season grass stand. In 2020 we are doubling the herd size that we will be using to manage the study. This will allow for greater impact and more frequent moves, theoretically leading to a more open canopy. Effectively we are walking a tight line between a nurse crop that limits weed germination and still allows for native grass seedlings to thrive.
This will be the final year for the field portion of the UT collaboration. The final results from the 2019 and 2020 study will be used for publication in scientific journals that focus on prairie ecology and/or agricultural production systems.
–Chad B.